Data visualization
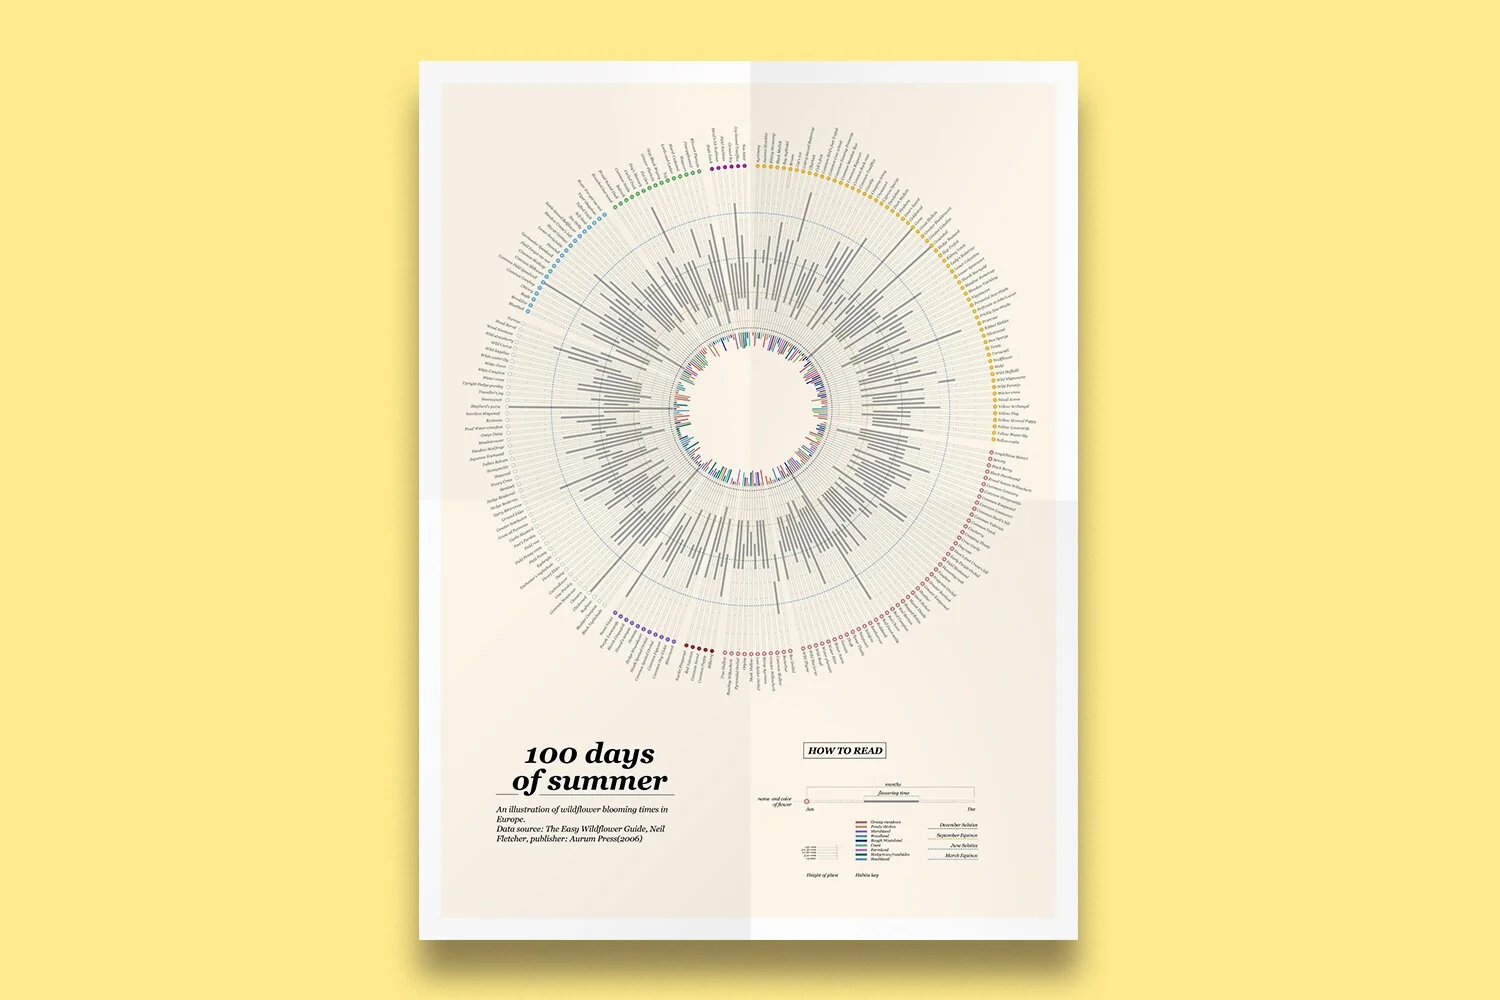
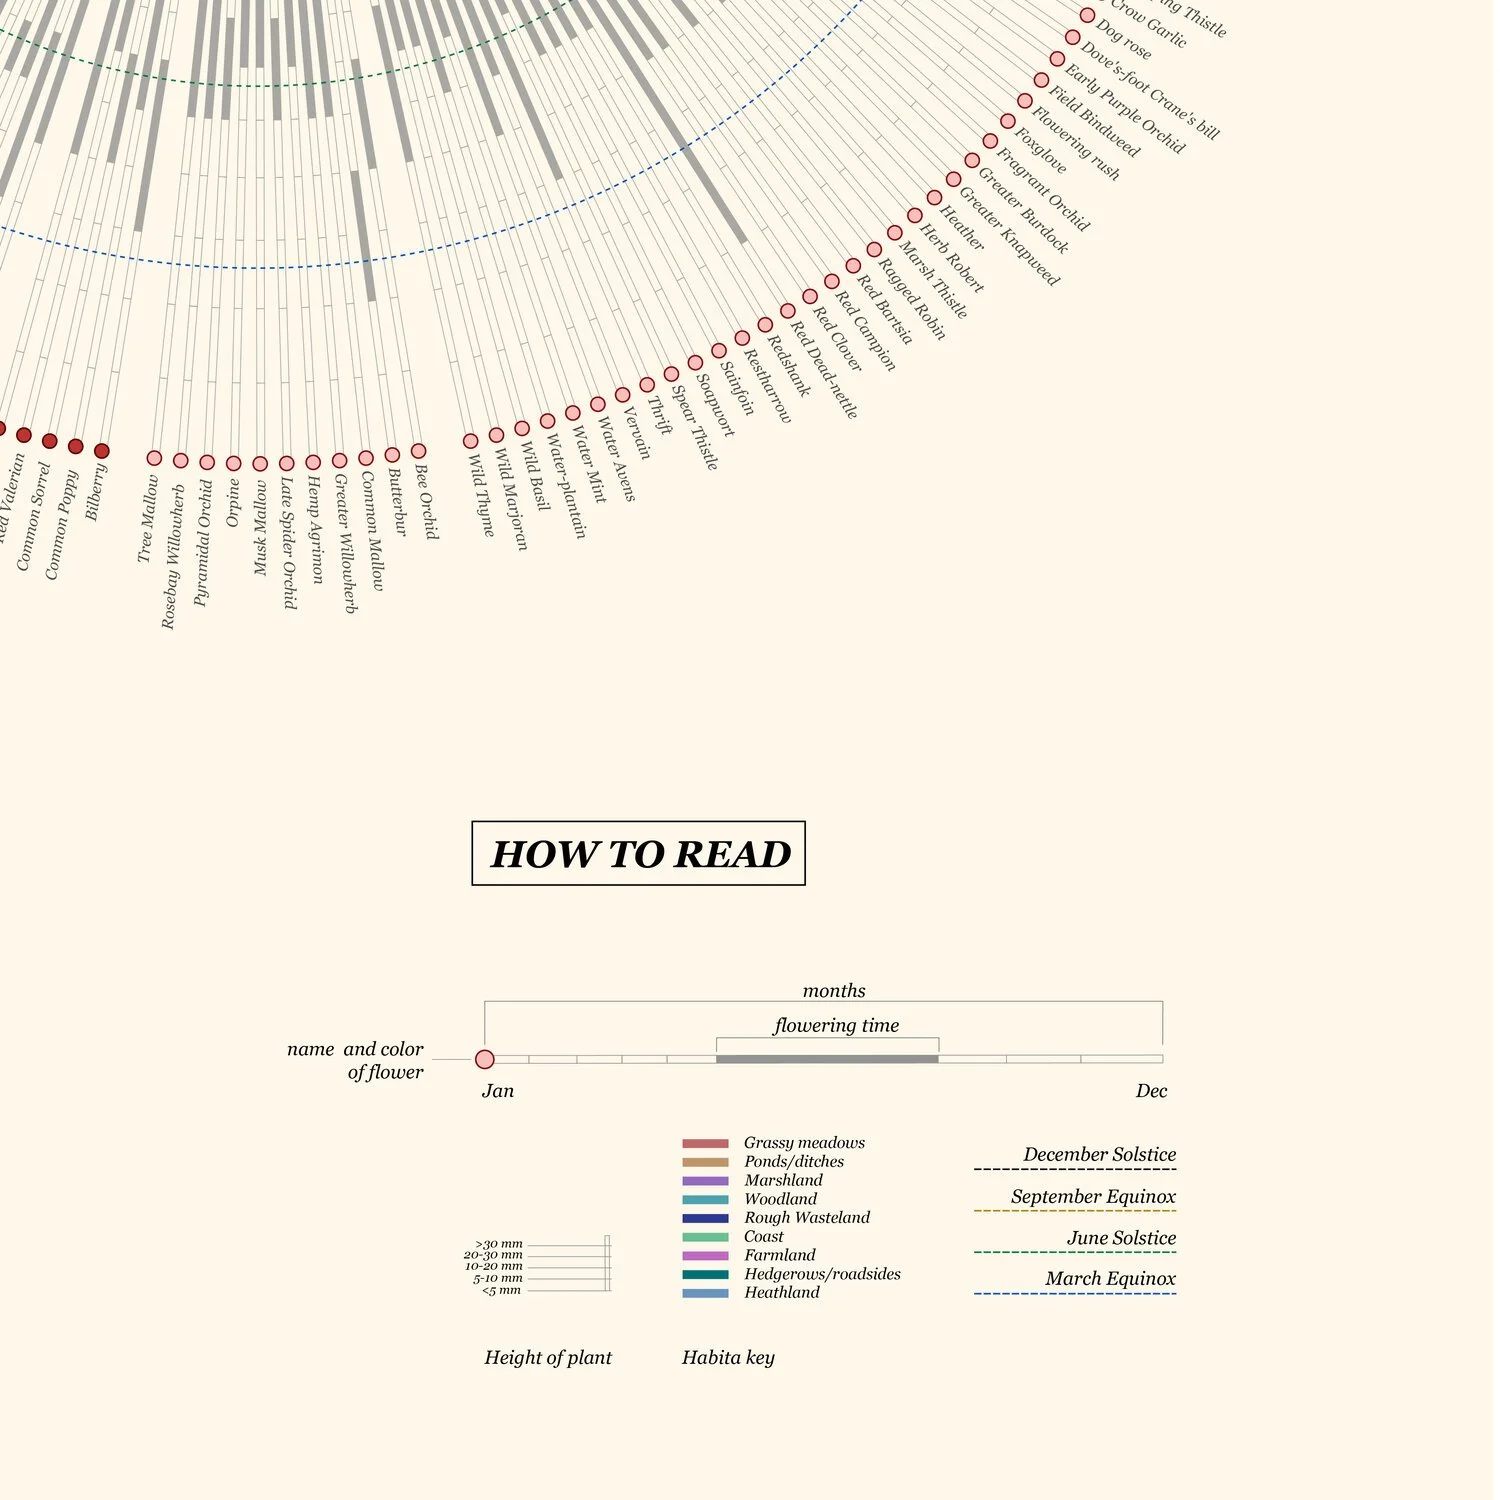
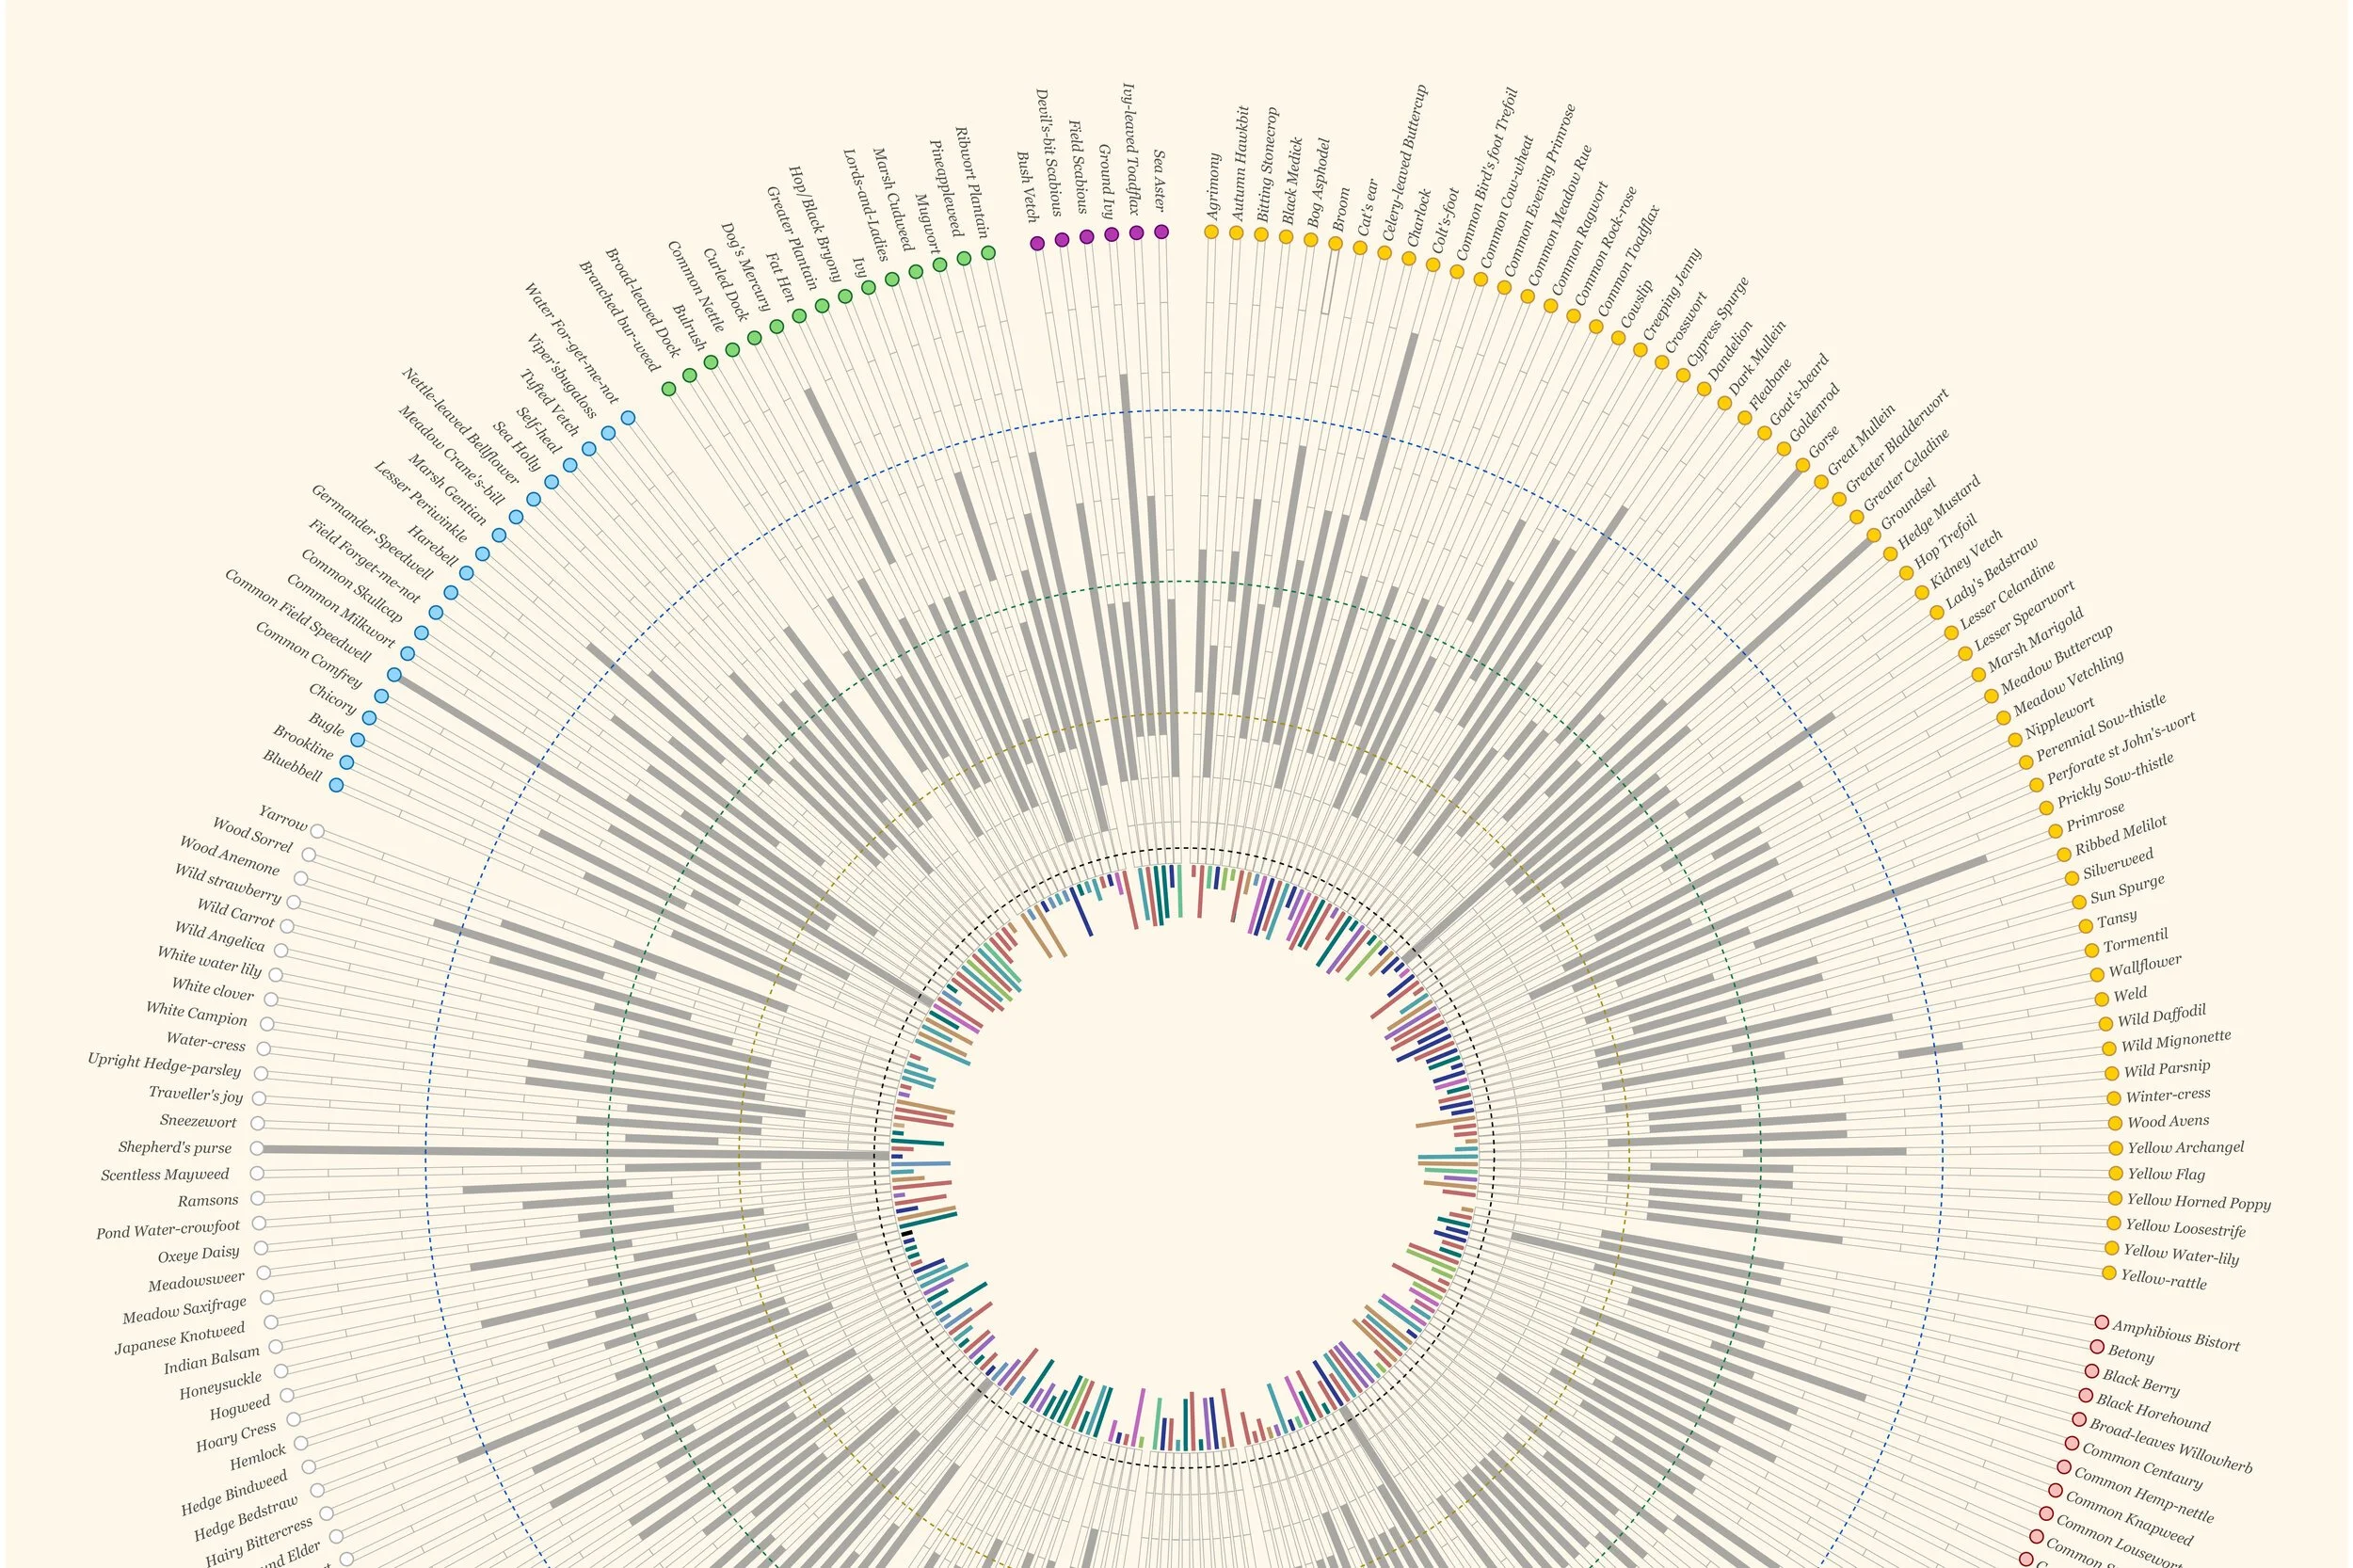
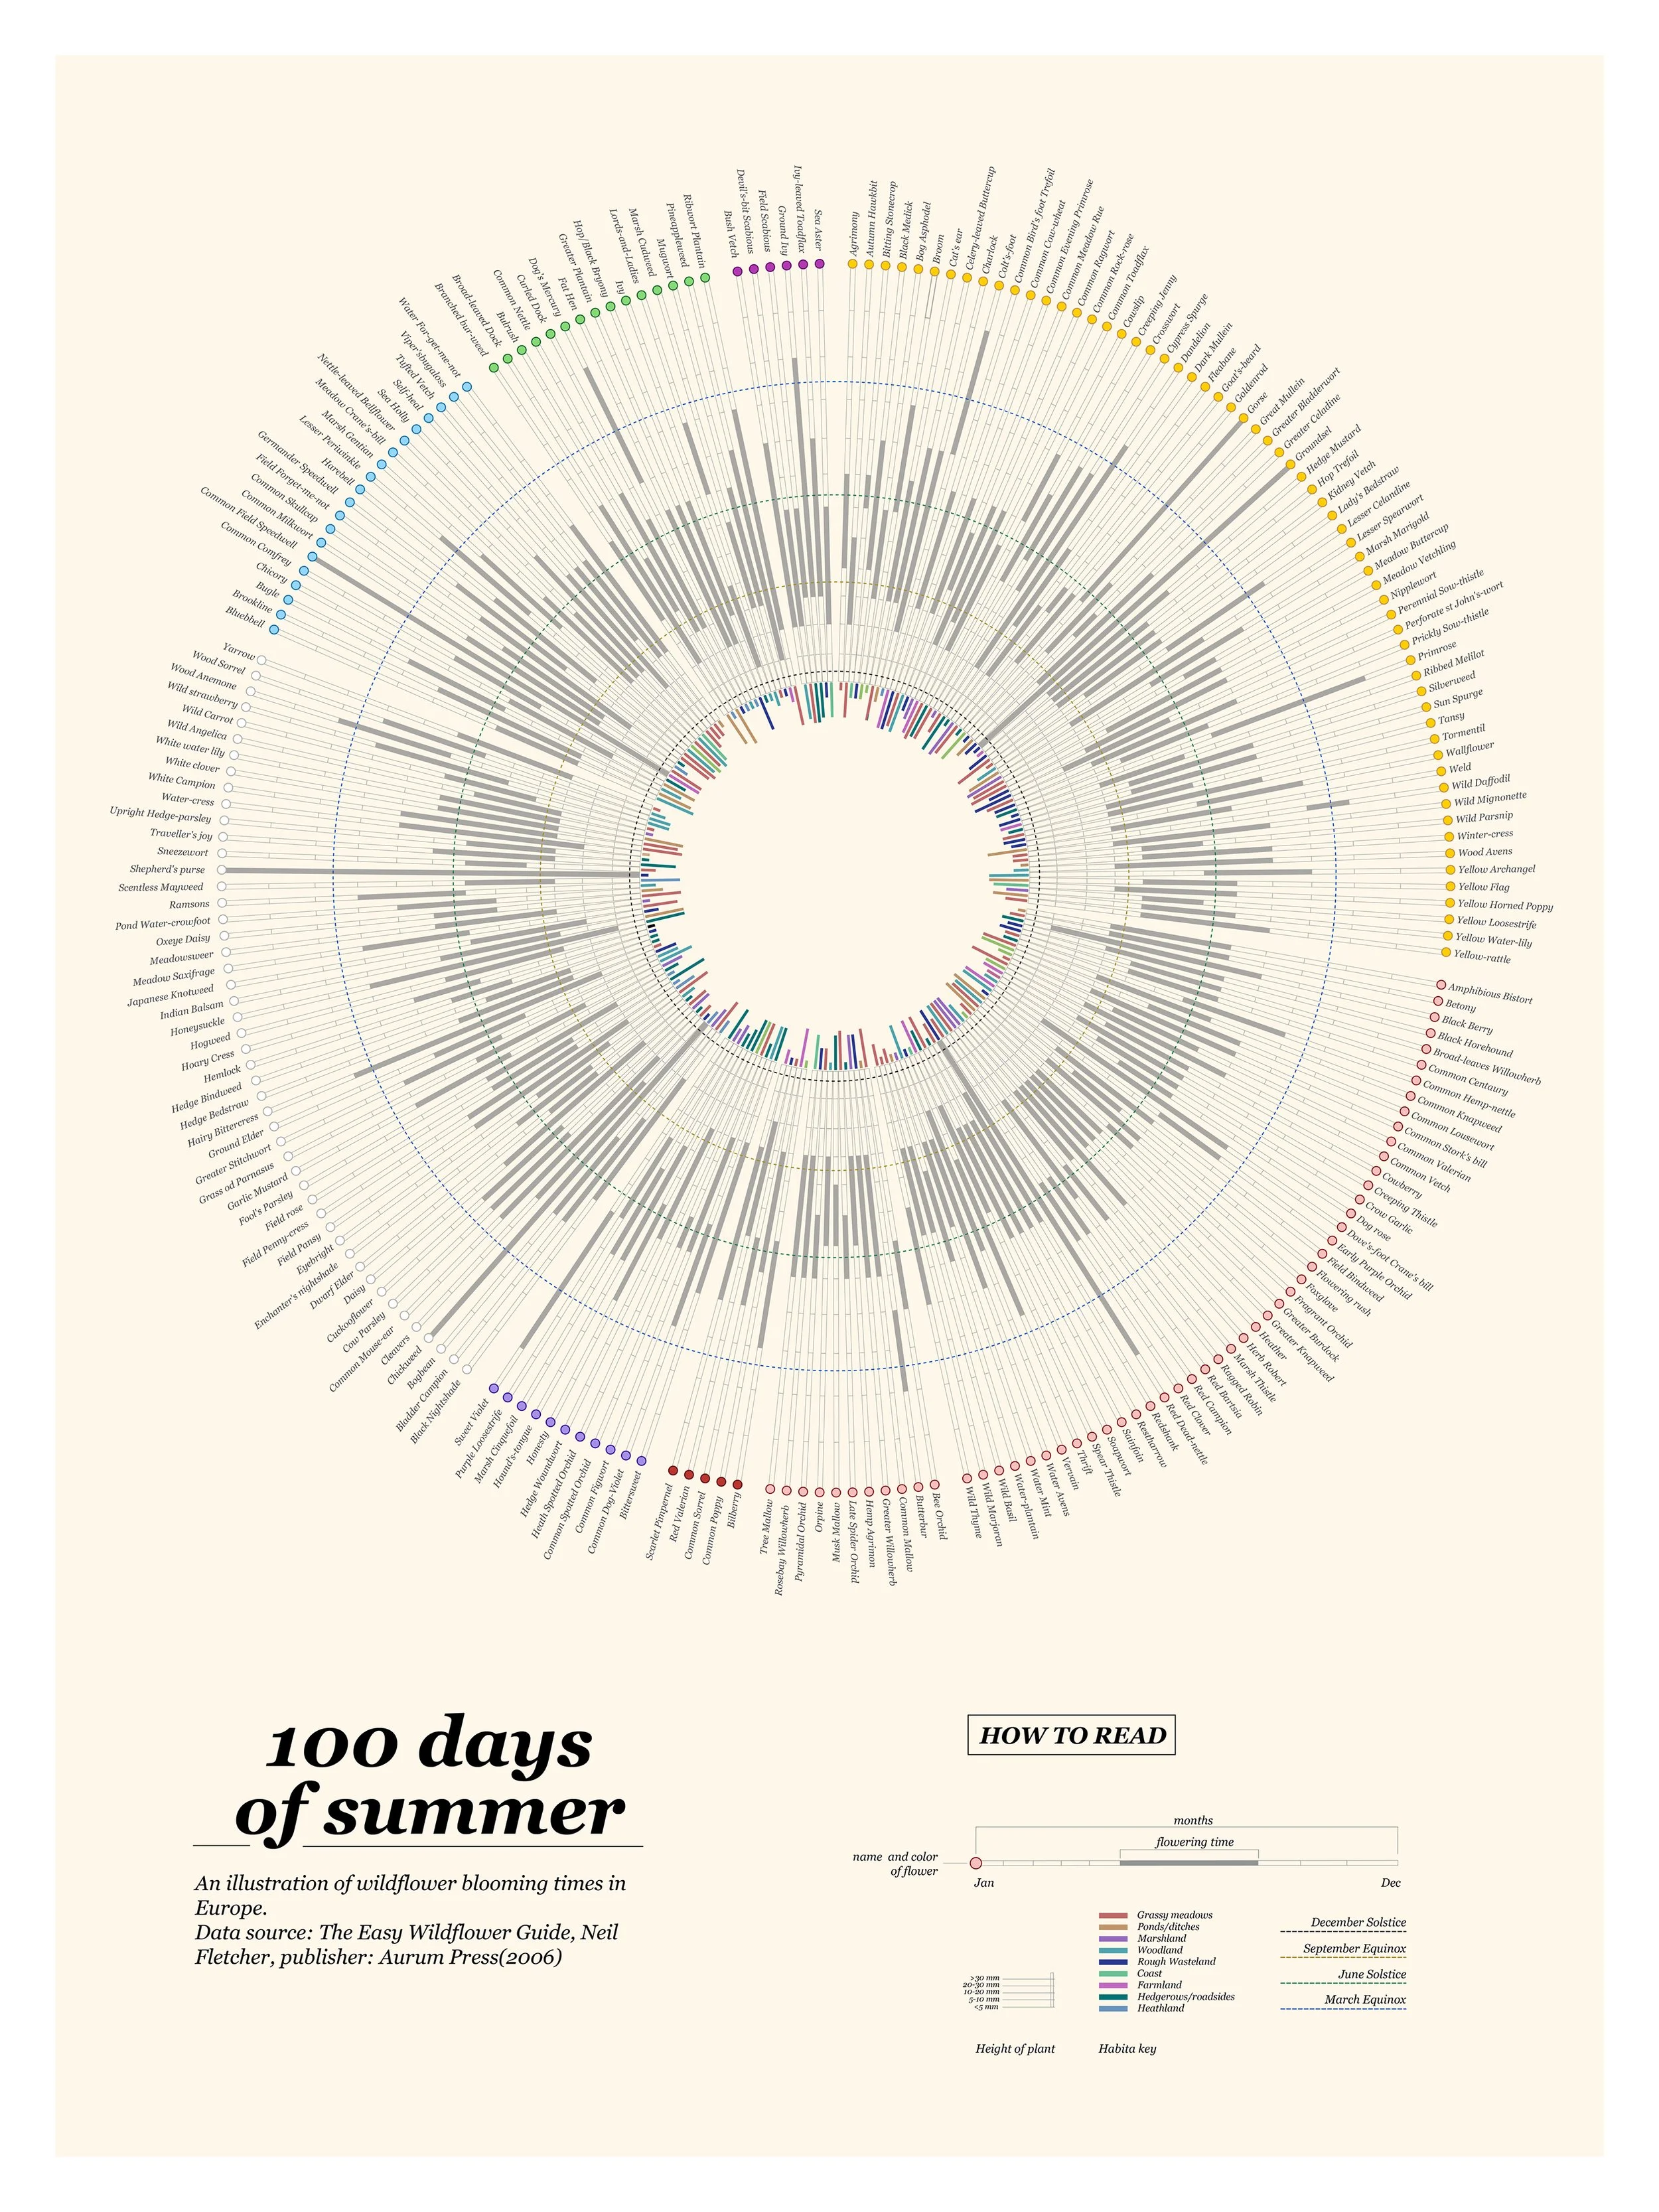
The summer in Finland is too short for any plant to grow, summer months in Nordic countries only last for about 3 months, approximately 100 days. Inspired by the book of Neil Fletcher, I want to make a data visualization about plant and their blooming times in Europe. The plants were divided to color groups, which represent color dots for each one, and the height of the plants getting along with colors in the smaller circle represents their habitat keys.
This is my summer project during school break in the summer 2017. Enjoy.